Uploaded image for project: 'Analytics'
  1. Analytics
  2. ANALYTICS-373

Widget with custom view does not show correct form when editing, happens since 6.2.11

XMLWordPrintable

      Steps to reproduce

      1.  Add new chart with data supplier is "Magnolia Recent Activities" -> Add chart to dashboard
      2.  Click on edit chart
      3. System show Edit widget dialog

      .. Logs, screenshots, gifs...
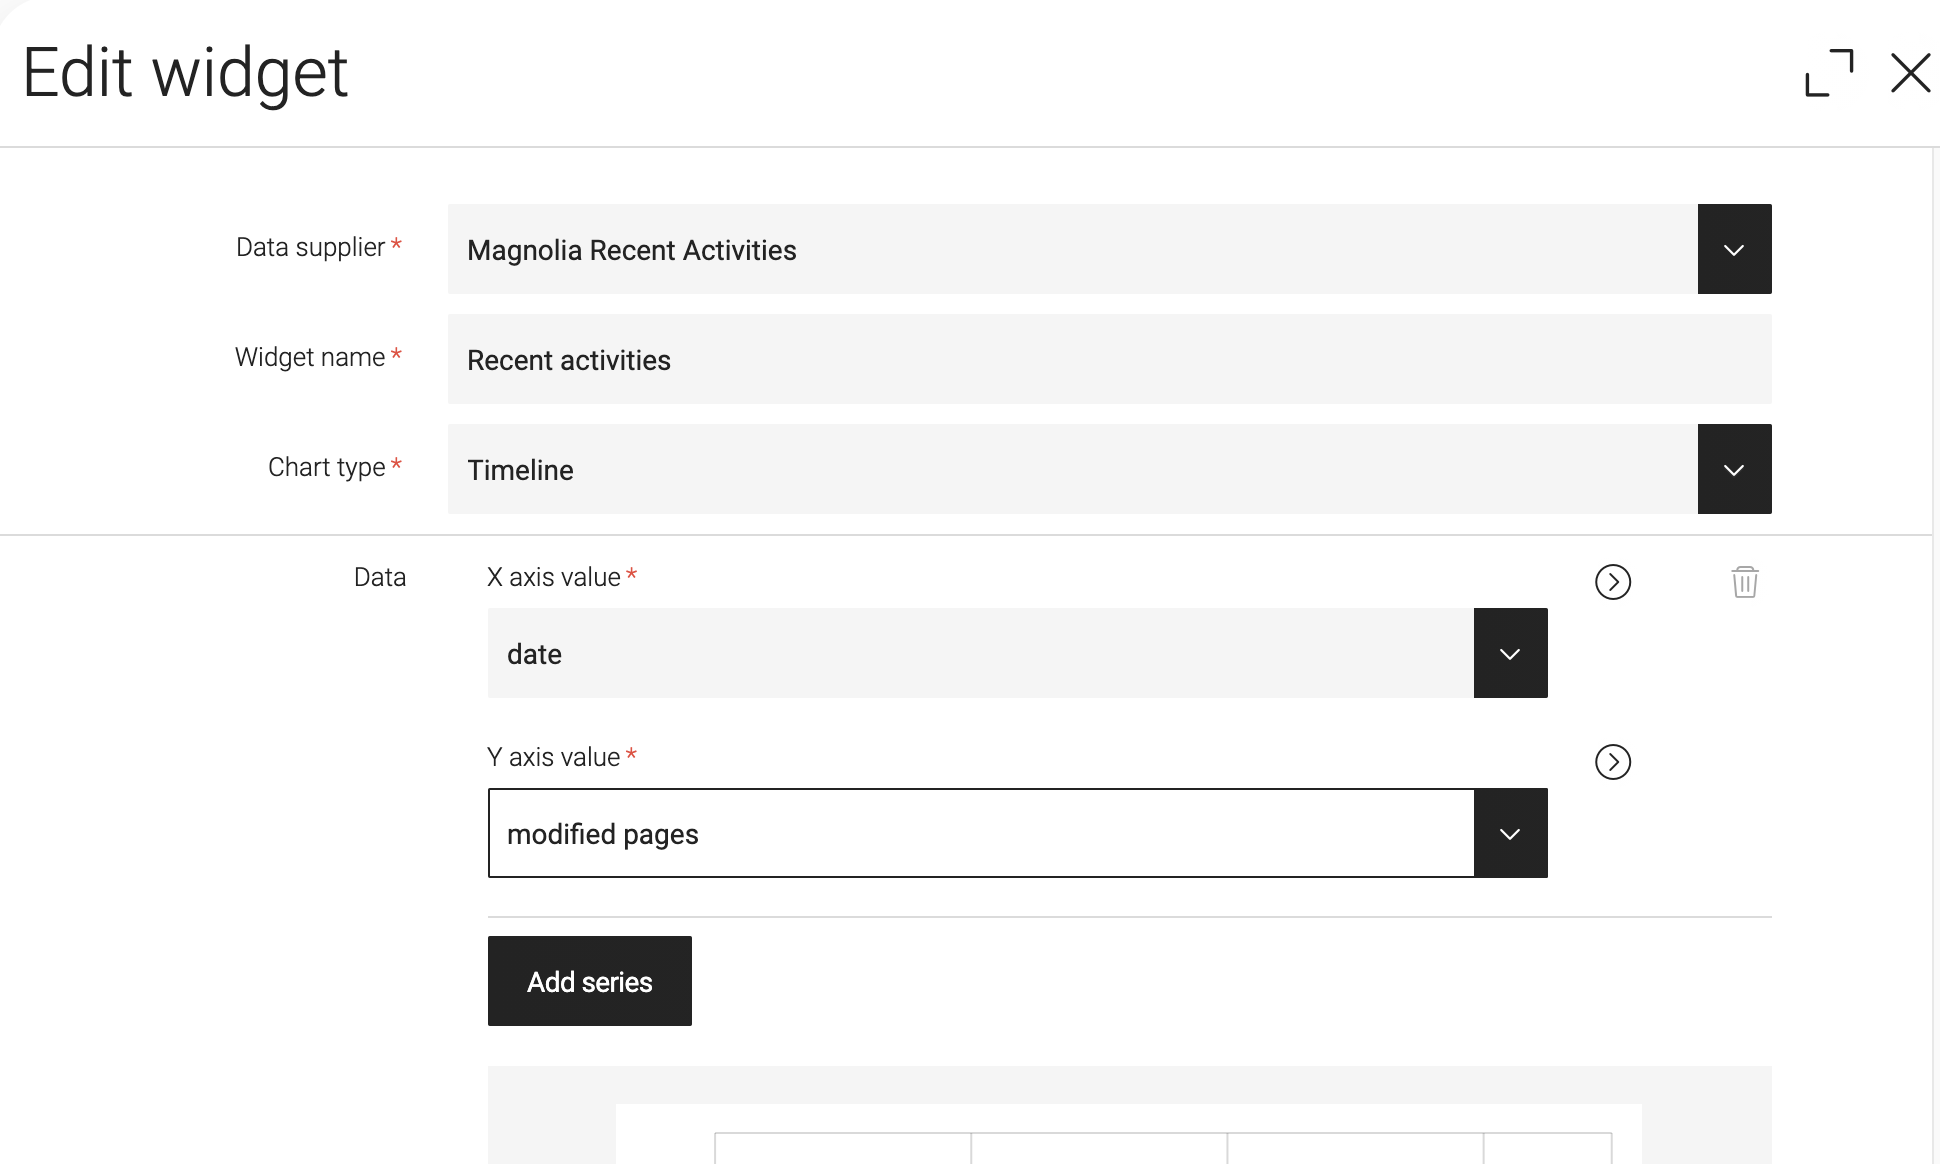
      Expected results

      Dialog should show X axis and Y asix with Chart type is "Timeline"
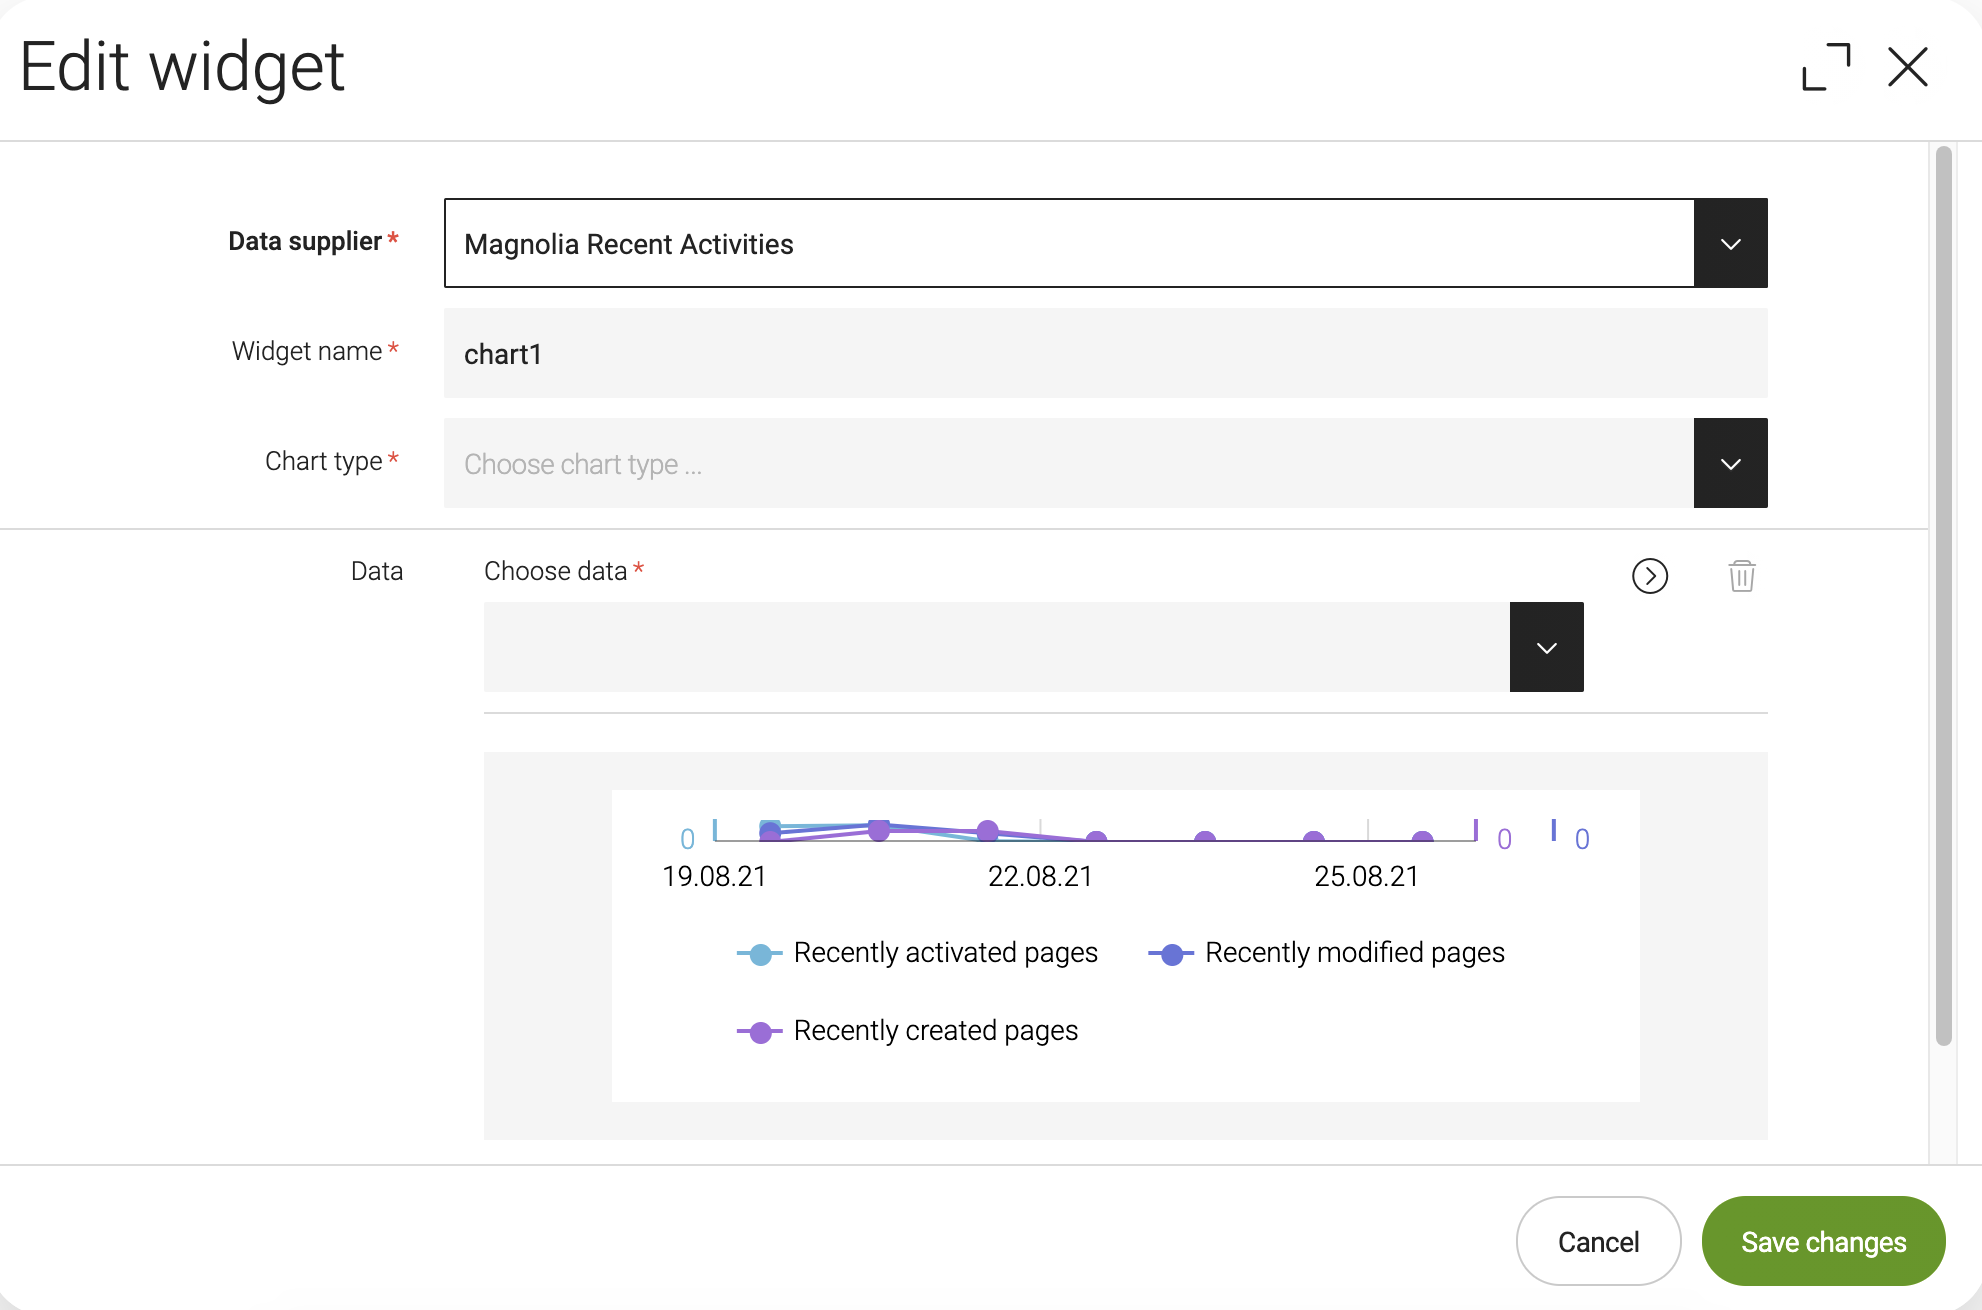
      Actual results

      Dialog show combobox "Choose data"

      Workaround

      Development notes

      dx core version 6.2.12-SNAPSHOT

        Acceptance criteria

              yen.lactue Yen Lac Tue
              yen.lactue Yen Lac Tue
              Votes:
              0 Vote for this issue
              Watchers:
              1 Start watching this issue

                Created:
                Updated:
                Resolved:

                  Bug DoR
                  Task DoD

                    Estimated:
                    Original Estimate - Not Specified
                    Not Specified
                    Remaining:
                    Remaining Estimate - Not Specified
                    Not Specified
                    Logged:
                    Time Spent - 5d 1h 5m
                    5d 1h 5m