-
Improvement
-
Resolution: Fixed
-
 Neutral
-
None
-
-
Empty show more show less
-
Content Mngmt 03
-
3
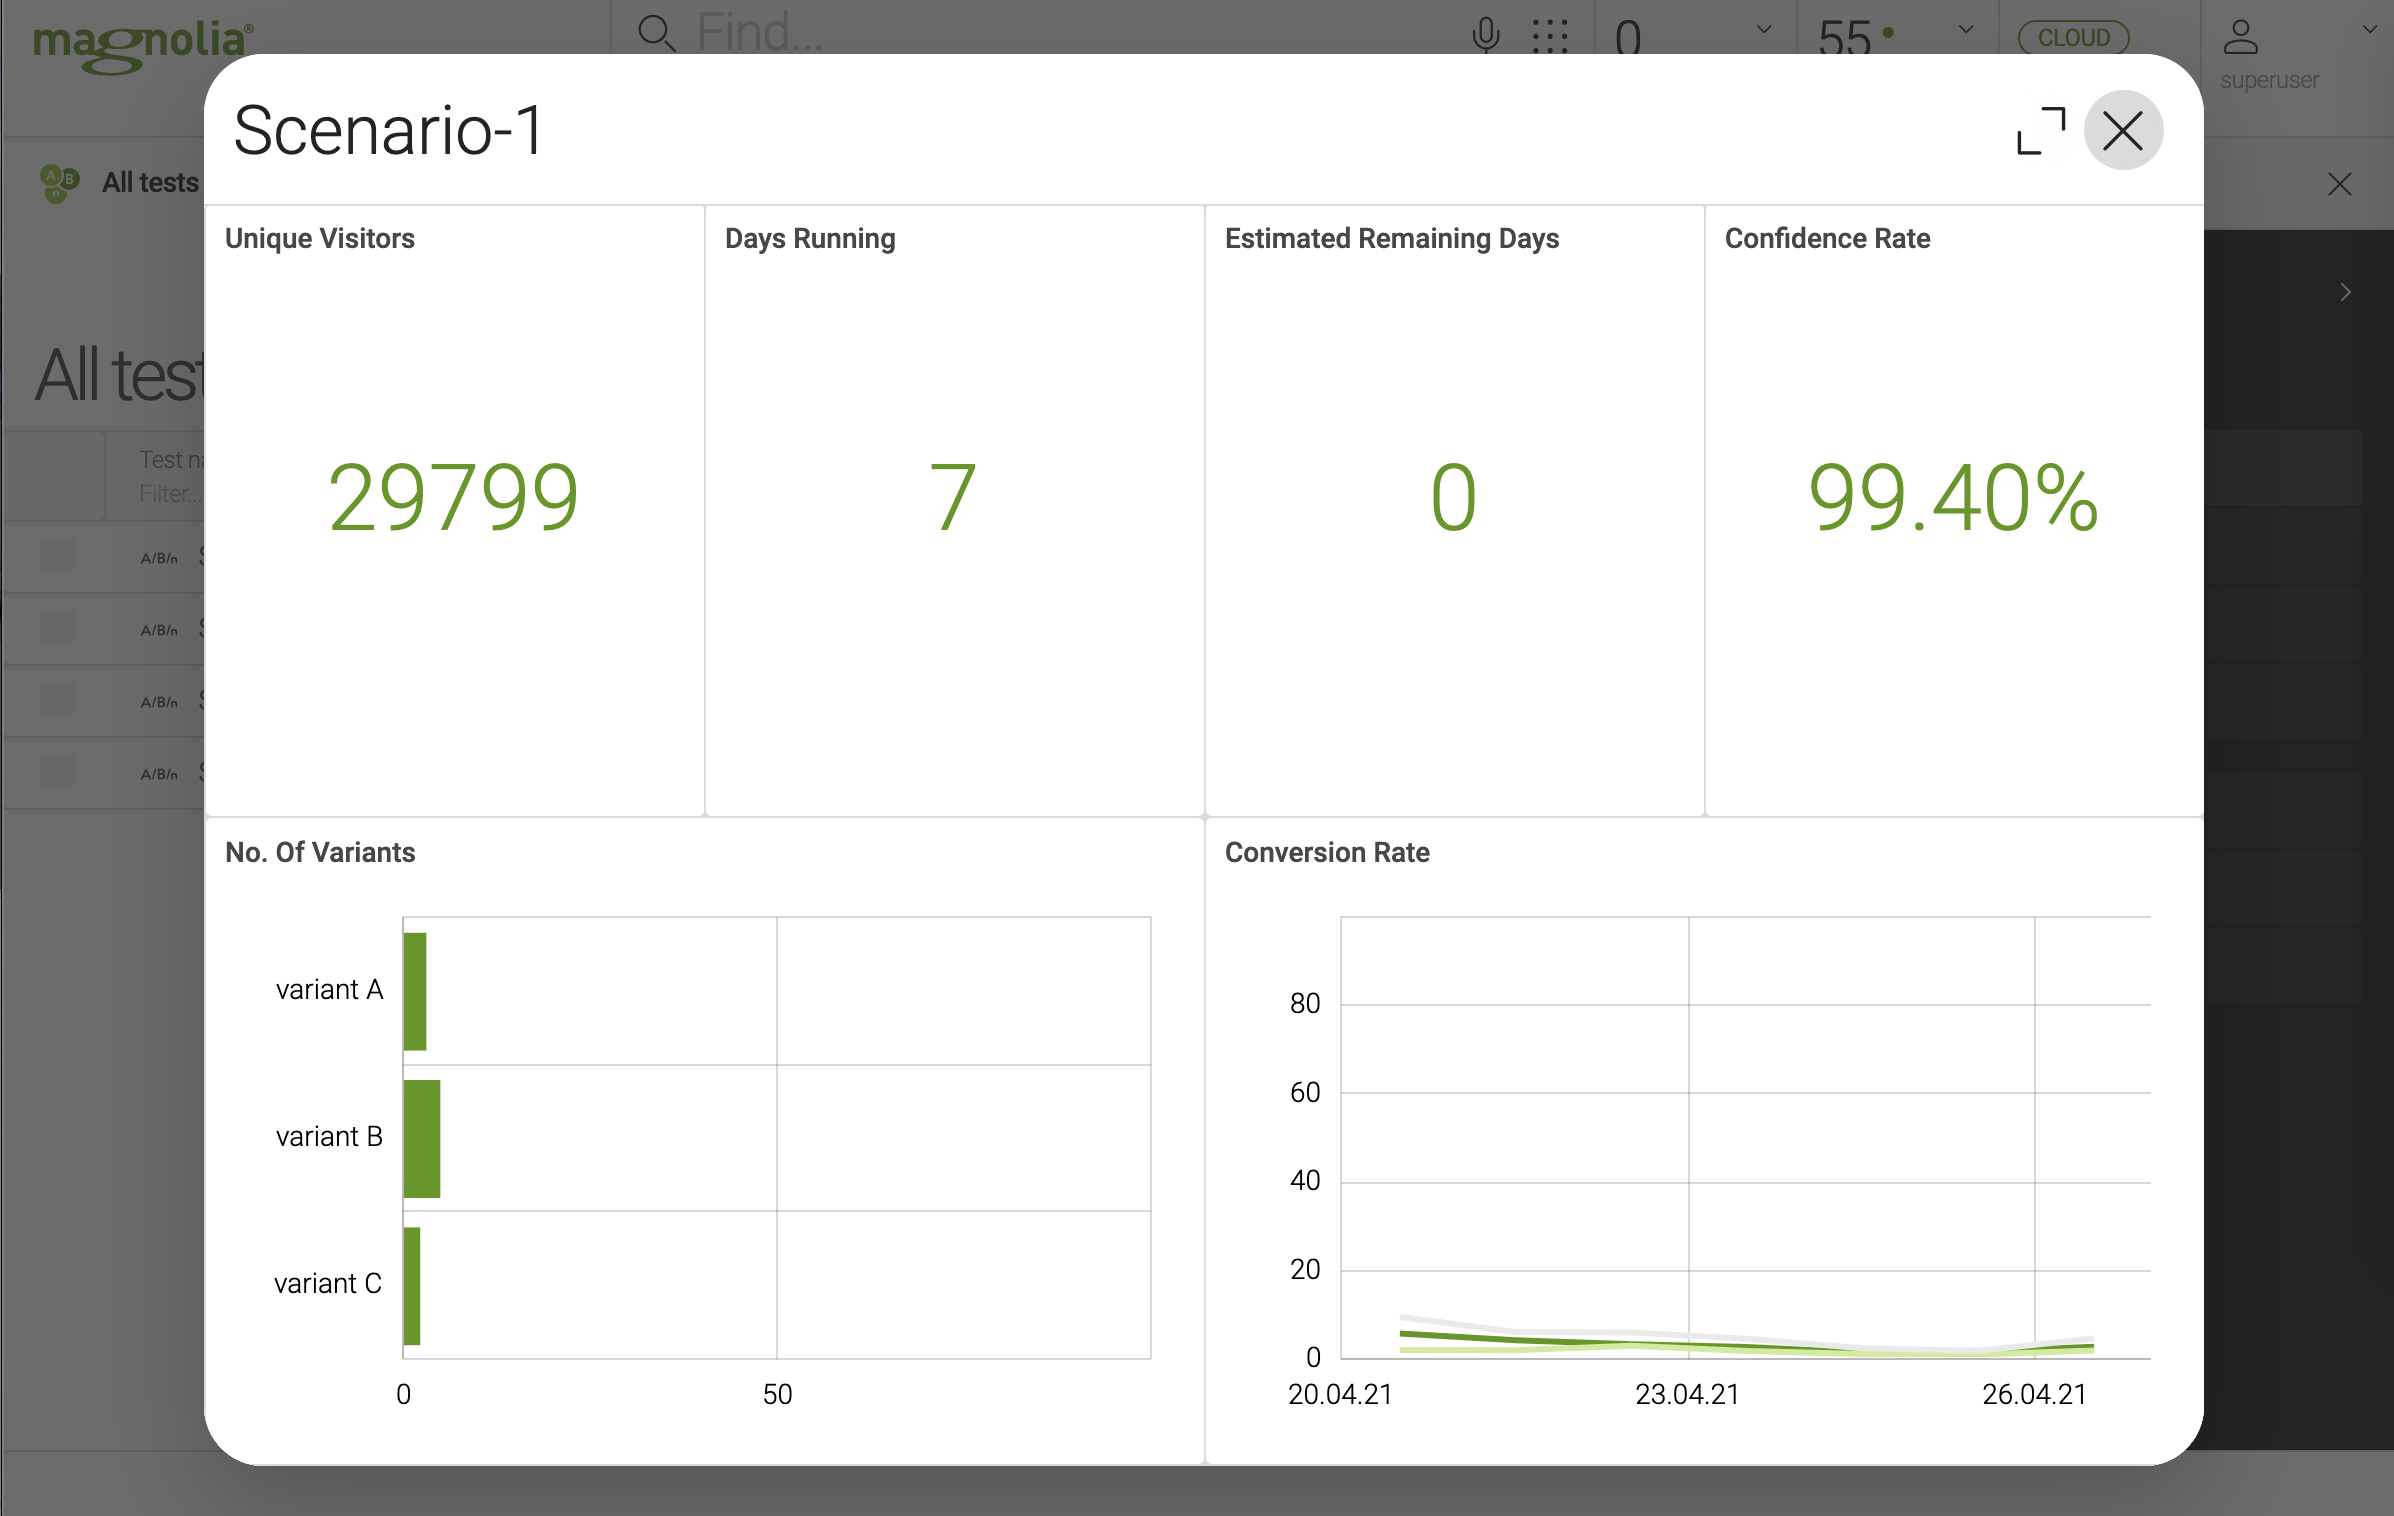
The y-axis of the conversion rate chart (in the test results) is fixed to show 0-100%. This often makes the charts hard to read as the actual conversion rates rarely are above 10%.
Additional note
This applies also to the bar chart:
- Bar chart --> axe x (horizontal) on the chart shows a reduce range (e.g. 0-10 instead of current 1-100
- Linear chart --. axe y is changed to 1-20
Desired behavior
- Scale dynamically
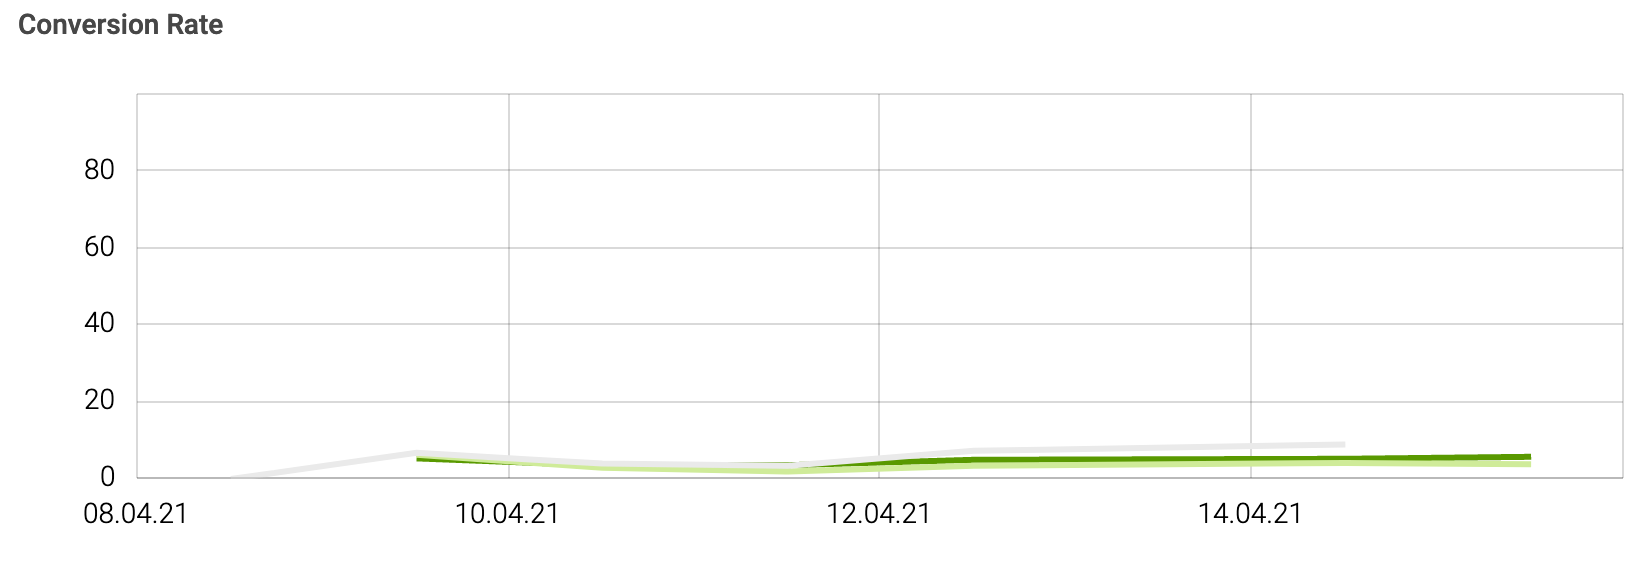
I suggest to dynamically adapt the y-axis to the range of the conversion rates.
Acceptance criteria

